

The Rupture Window
Two Instruments Converge

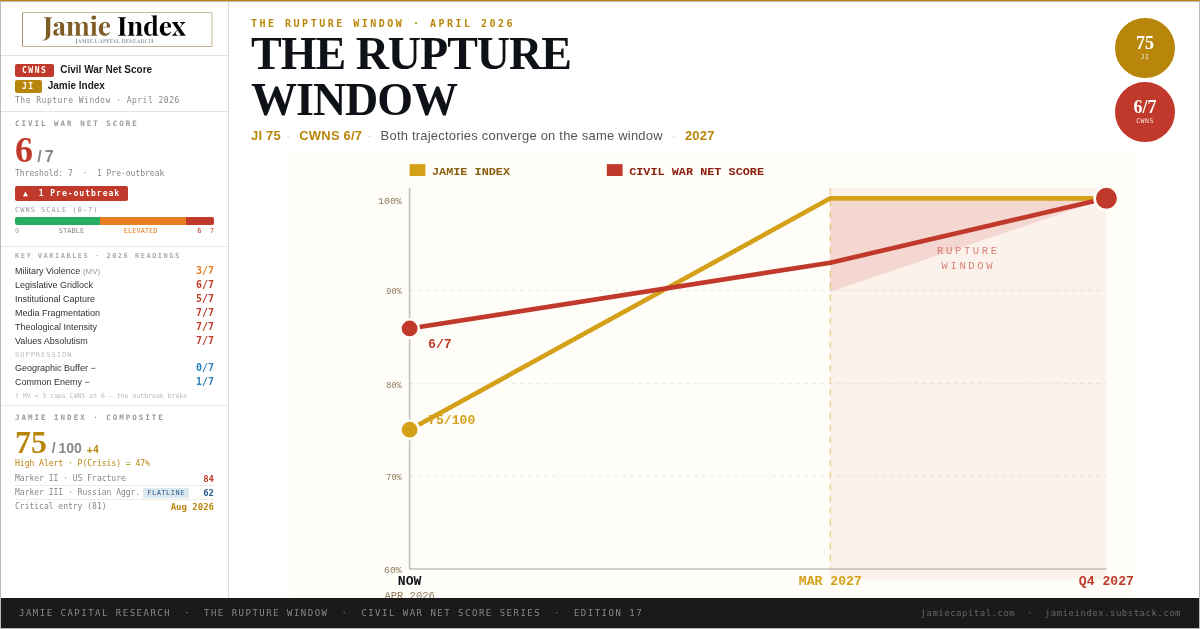
The Jamie Index now reads 75. The Civil War Net Score reads 6 of 7 — one structural variable from the historical outbreak threshold. I built both instruments independently, from different crises, using different formulas. They are pointing to the same 18-month window. This post is about what that means.
Two Instruments, Built Separately
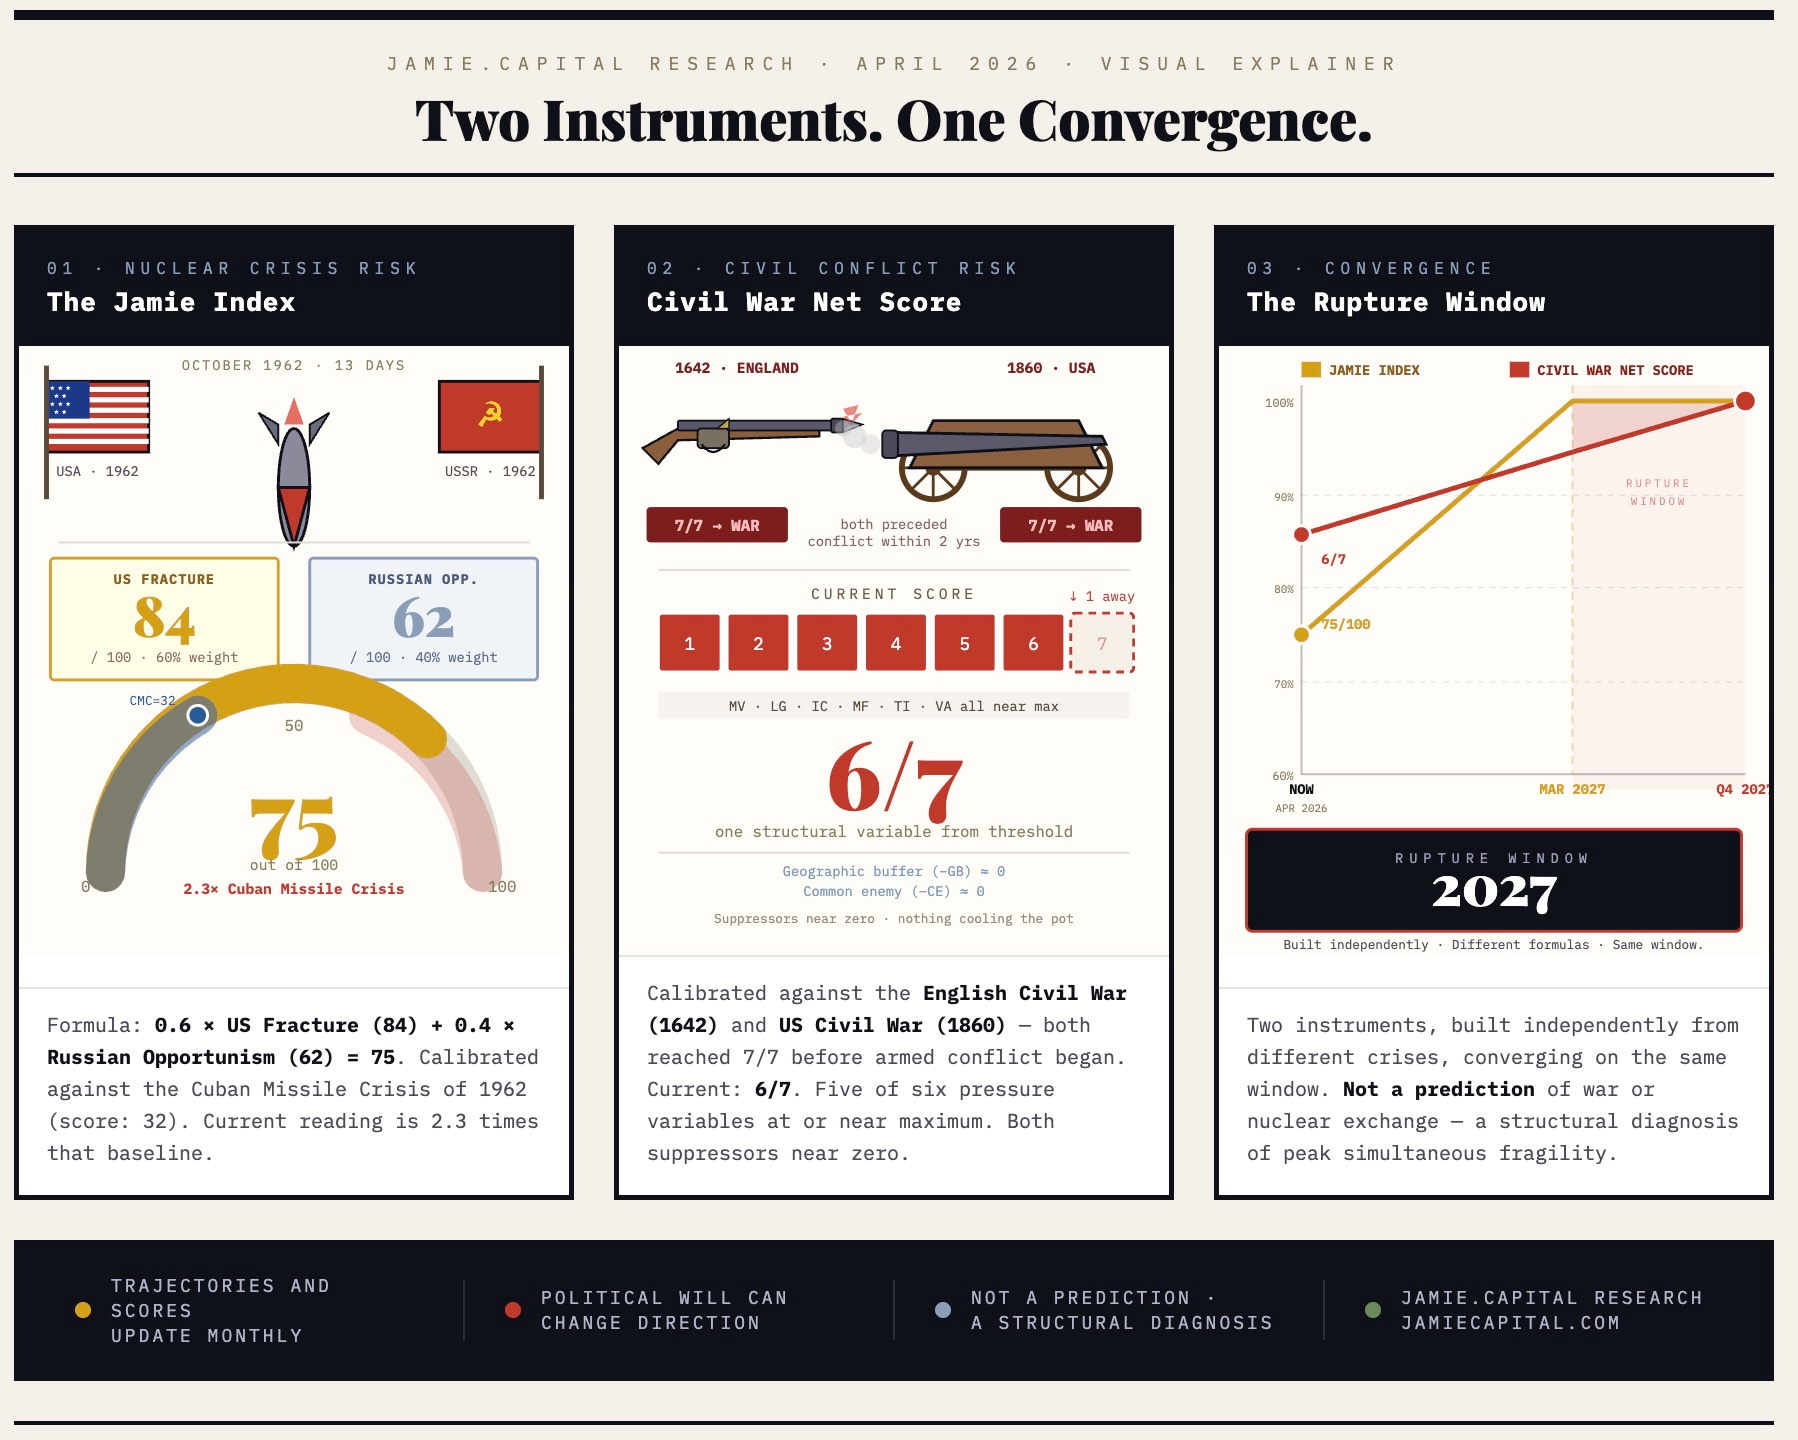
The Jamie Index was built on one question: how does the structural risk of nuclear crisis — measured across US institutional fragility and Russian geopolitical opportunism — compare to the Cuban Missile Crisis of 1962? The Crisis baseline was 32. The current reading is 75. That is 2.3 times the Cuban Missile Crisis level.
The Civil War Net Score was built on a different question entirely: how closely does the current structural configuration of the United States match the pre-outbreak stage of the English Civil War? It is calibrated against seven historical periods. The English Civil War of 1642 and the American Civil War of 1860 both reached 7 of 7 before armed conflict began. The current reading is 6 of 7.
These are not variants of the same model. They share no variables, no calibration periods, no formula structure. They were built to answer different questions using different evidence. What they share is a direction of travel — and a projected destination.
Four Centuries of Structural Pressure
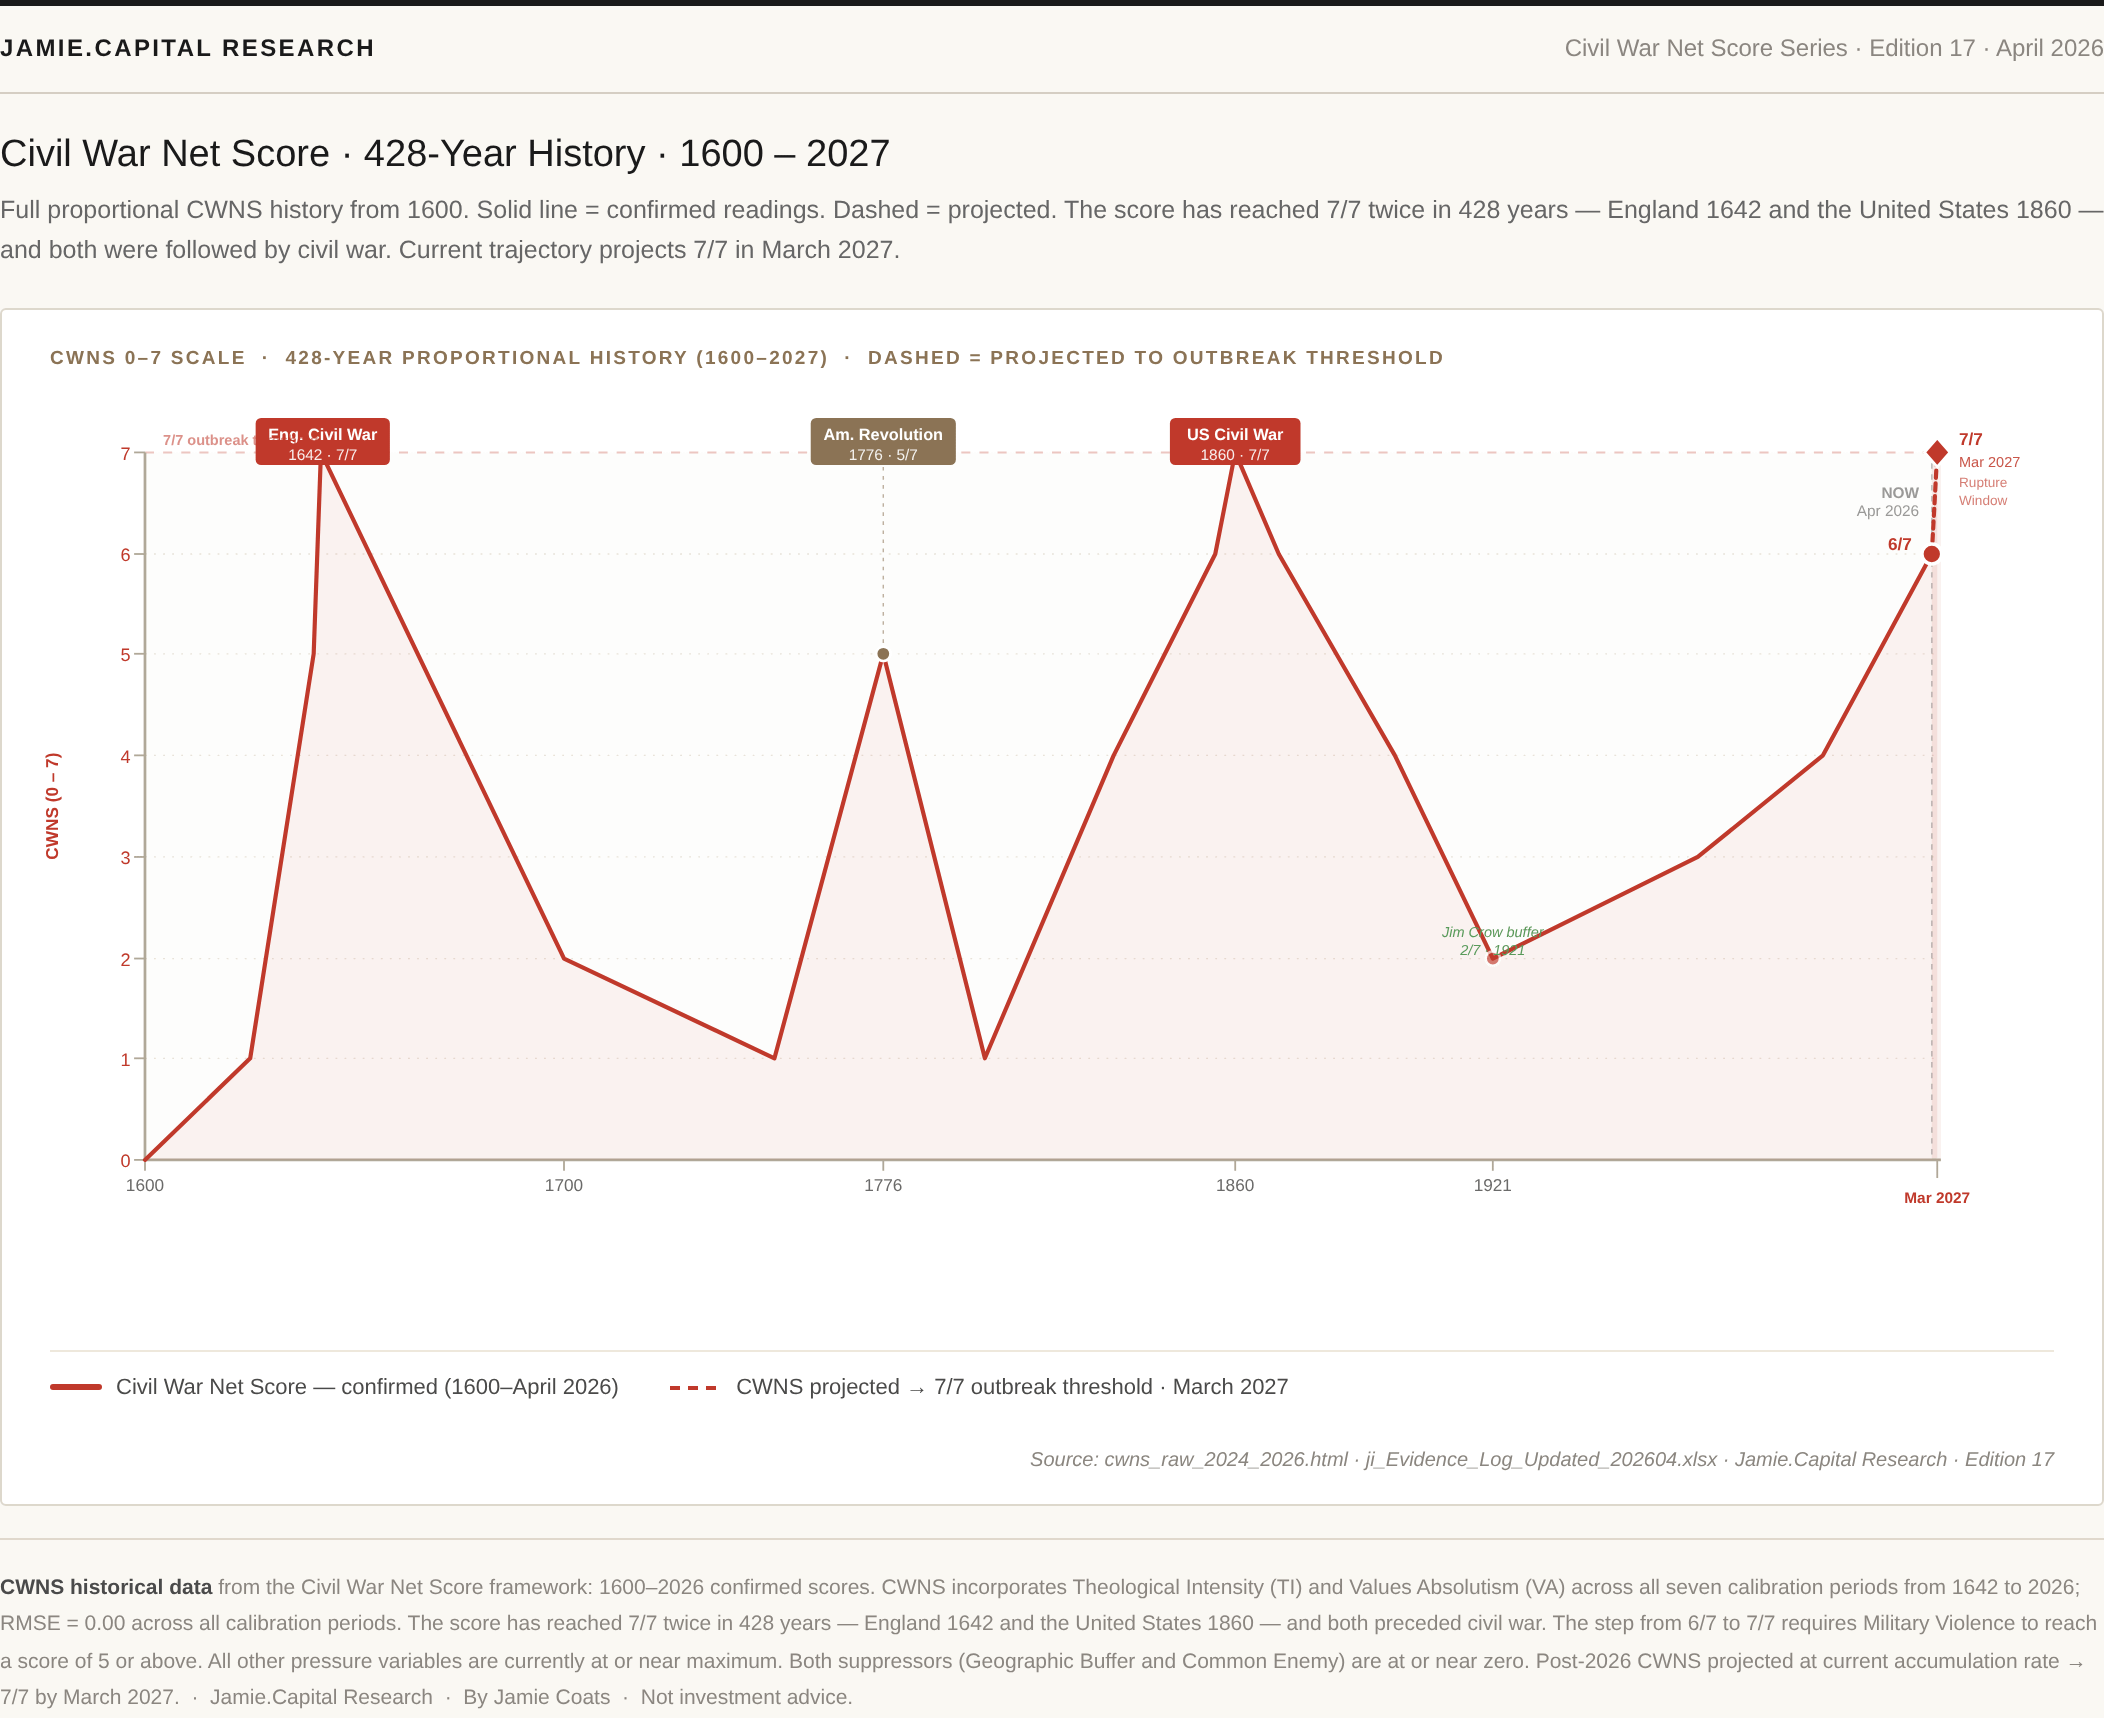
The Civil War Net Score (CWNS) is not a commentary on current events alone. Its scoring framework was calibrated against seven historical periods of civil conflict — from the English Civil War of 1642 to the present day. When you plot the CWNS reading across the full span of documented American history, from the colonial period to today, the trajectory of the last six years is not unprecedented in character — but it is unprecedented in pace.
The chart below plots 428 years of CWNS readings. The current reading of 6 of 7 sits against its full historical context. Prior periods that reached 6 of 7 were followed, without exception, by either an outbreak or a structural reset driven by a major suppressor — a common enemy, a geographic buffer, or a resolution of the underlying values conflict. None of those mechanisms is currently operating.
Two Years of Rise — and the Window Ahead
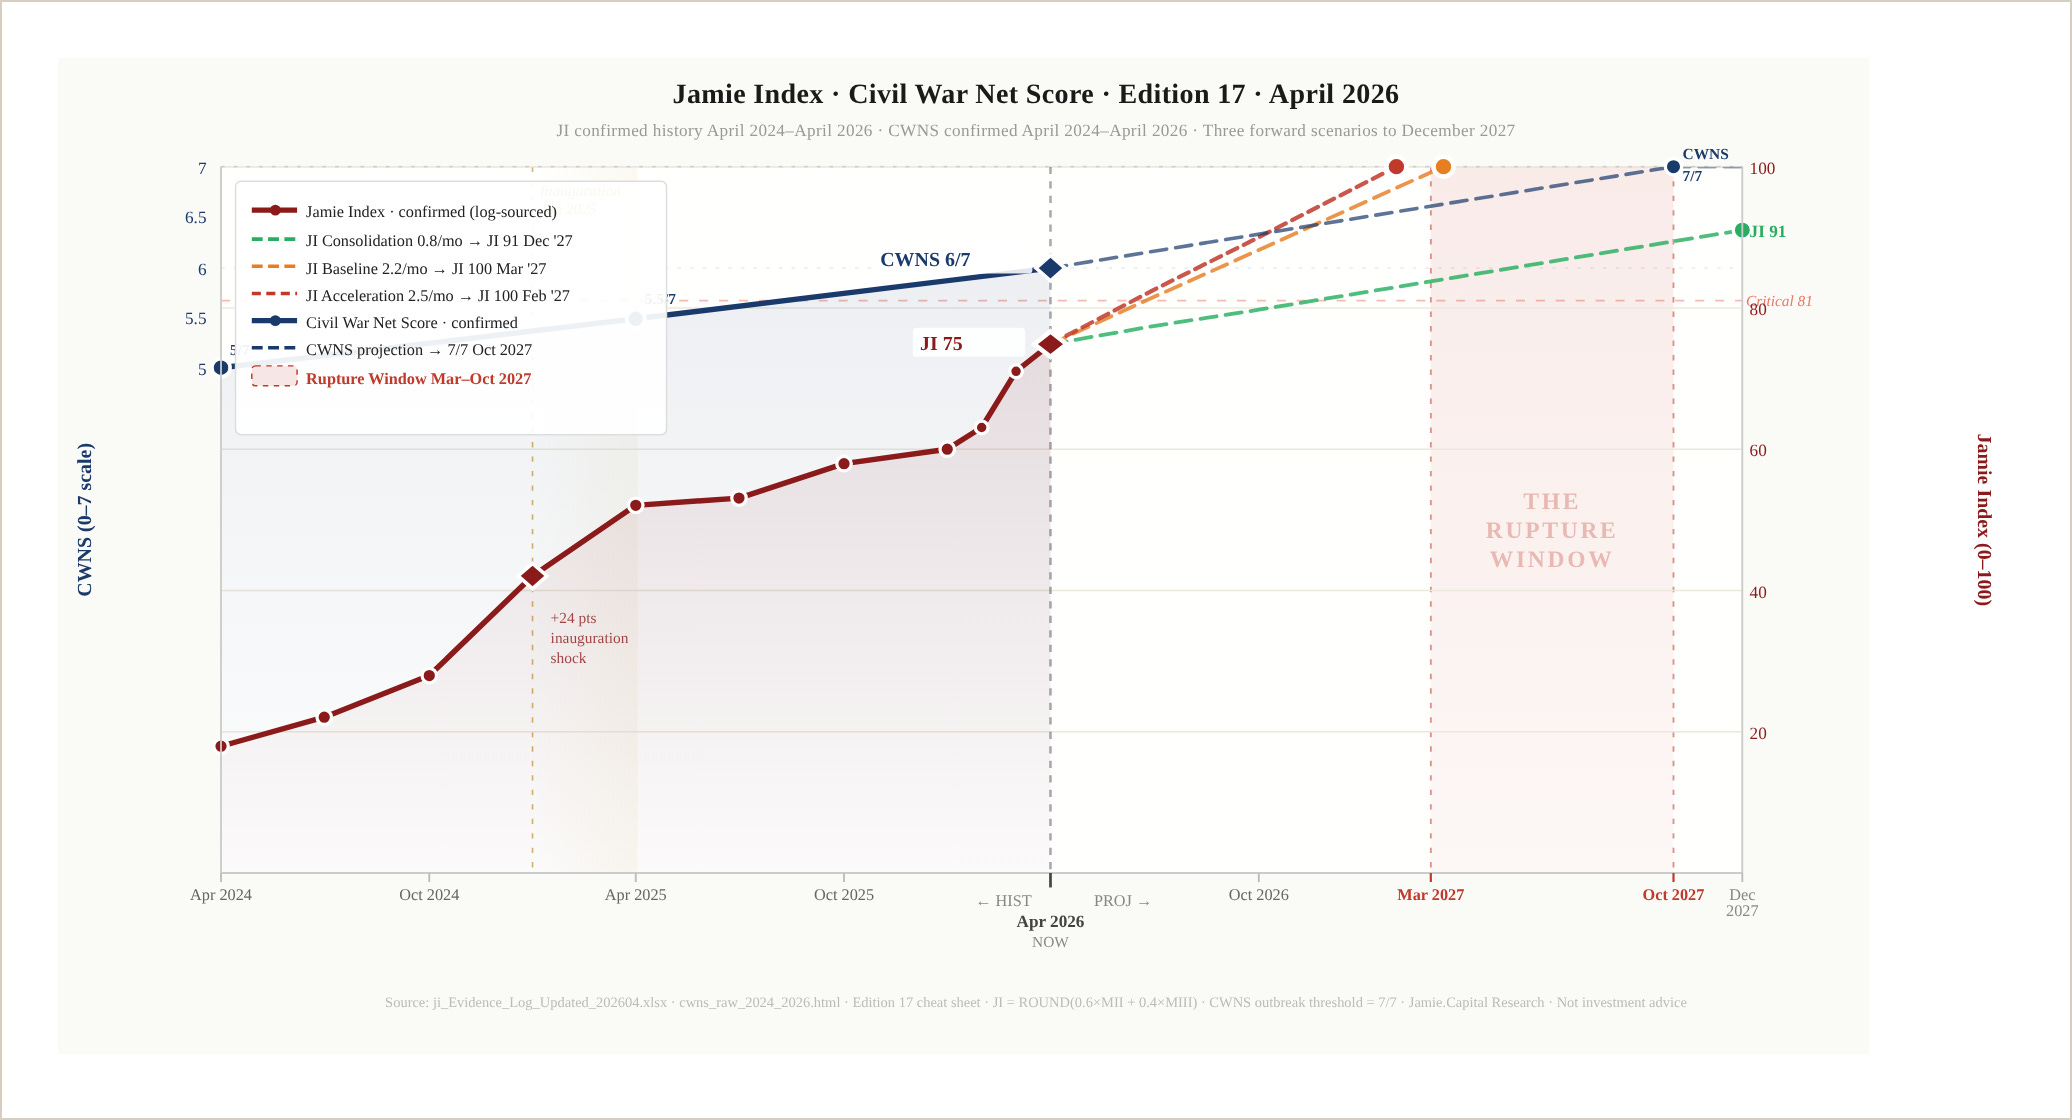
The chart below shows both instruments across the full analytical horizon in a single view: confirmed historical readings from April 2024 to April 2026, and the three forward scenarios projected to December 2027. This is one chart because the analytical point is a single point — both instruments are rising, independently, toward the same window.
From April 2024 to April 2026, the Jamie Index has moved from 18 to 75: through the Elevated Band, into the High Alert Band, closing on the Critical threshold at 81. The Civil War Net Score has risen from 5 of 7 to 6 of 7: one structural variable from the historical outbreak threshold that both England in 1642 and America in 1860 crossed before armed conflict began. These two instruments share no variables, no calibration periods, no formula structure. Both are rising.
The three forward scenarios
1. Consolidation (0.8 points per month)
2. Baseline (2.2 points per month), and
3. Acceleration (2.5 points per month) — bracket a range of outcomes.
Under Consolidation, the Jamie Index reaches 91 by December 2027.
Under Baseline and Acceleration, the index reaches its cap of 100 — Critical — between March and July 2027.
Simultaneously, the Civil War Net Score projection reaches 6.9 of 7 by Quarter four 2027. The period in which both instruments simultaneously press against their critical thresholds — approximately March to October 2027 — is the Rupture Window.
That window is what I am calling the Rupture Window. It is not a prediction. It is the period in which two independently constructed instruments — one measuring nuclear crisis risk, one measuring civil war structural proximity — are projected to simultaneously reach their critical thresholds. The convergence is structural, not rhetorical.
Two instruments built from different crises, using different methods, calibrated against different historical periods. They point to the same window. That is not one instrument making a strong claim. It is two instruments, built to disagree, choosing not to.
🔒
Premium Content Below
Paid subscribers receive the full analysis: the three-component breakdown of the Jamie Index, the Russian flatline explained, what would need to change for a different outcome, and the investment positioning signal.
Subscribe at jamiecapital.com · jamieindex.substack.com